How to Find Standard Deviation in Excel: A Comprehensive Guide
Understanding how to find standard deviation in Excel is essential for anyone involved in data analysis, statistical research, or business analytics. This guide will simplify the process for you, covering various methods and examples that will enhance your data management skills in Excel. Whether you’re a beginner or looking to refine your knowledge, we’ll explore everything from the basic formulas to advanced functions used for computing standard deviation. Let’s dive into the essential steps of finding standard deviation in Excel.
Understanding Standard Deviation and Its Importance
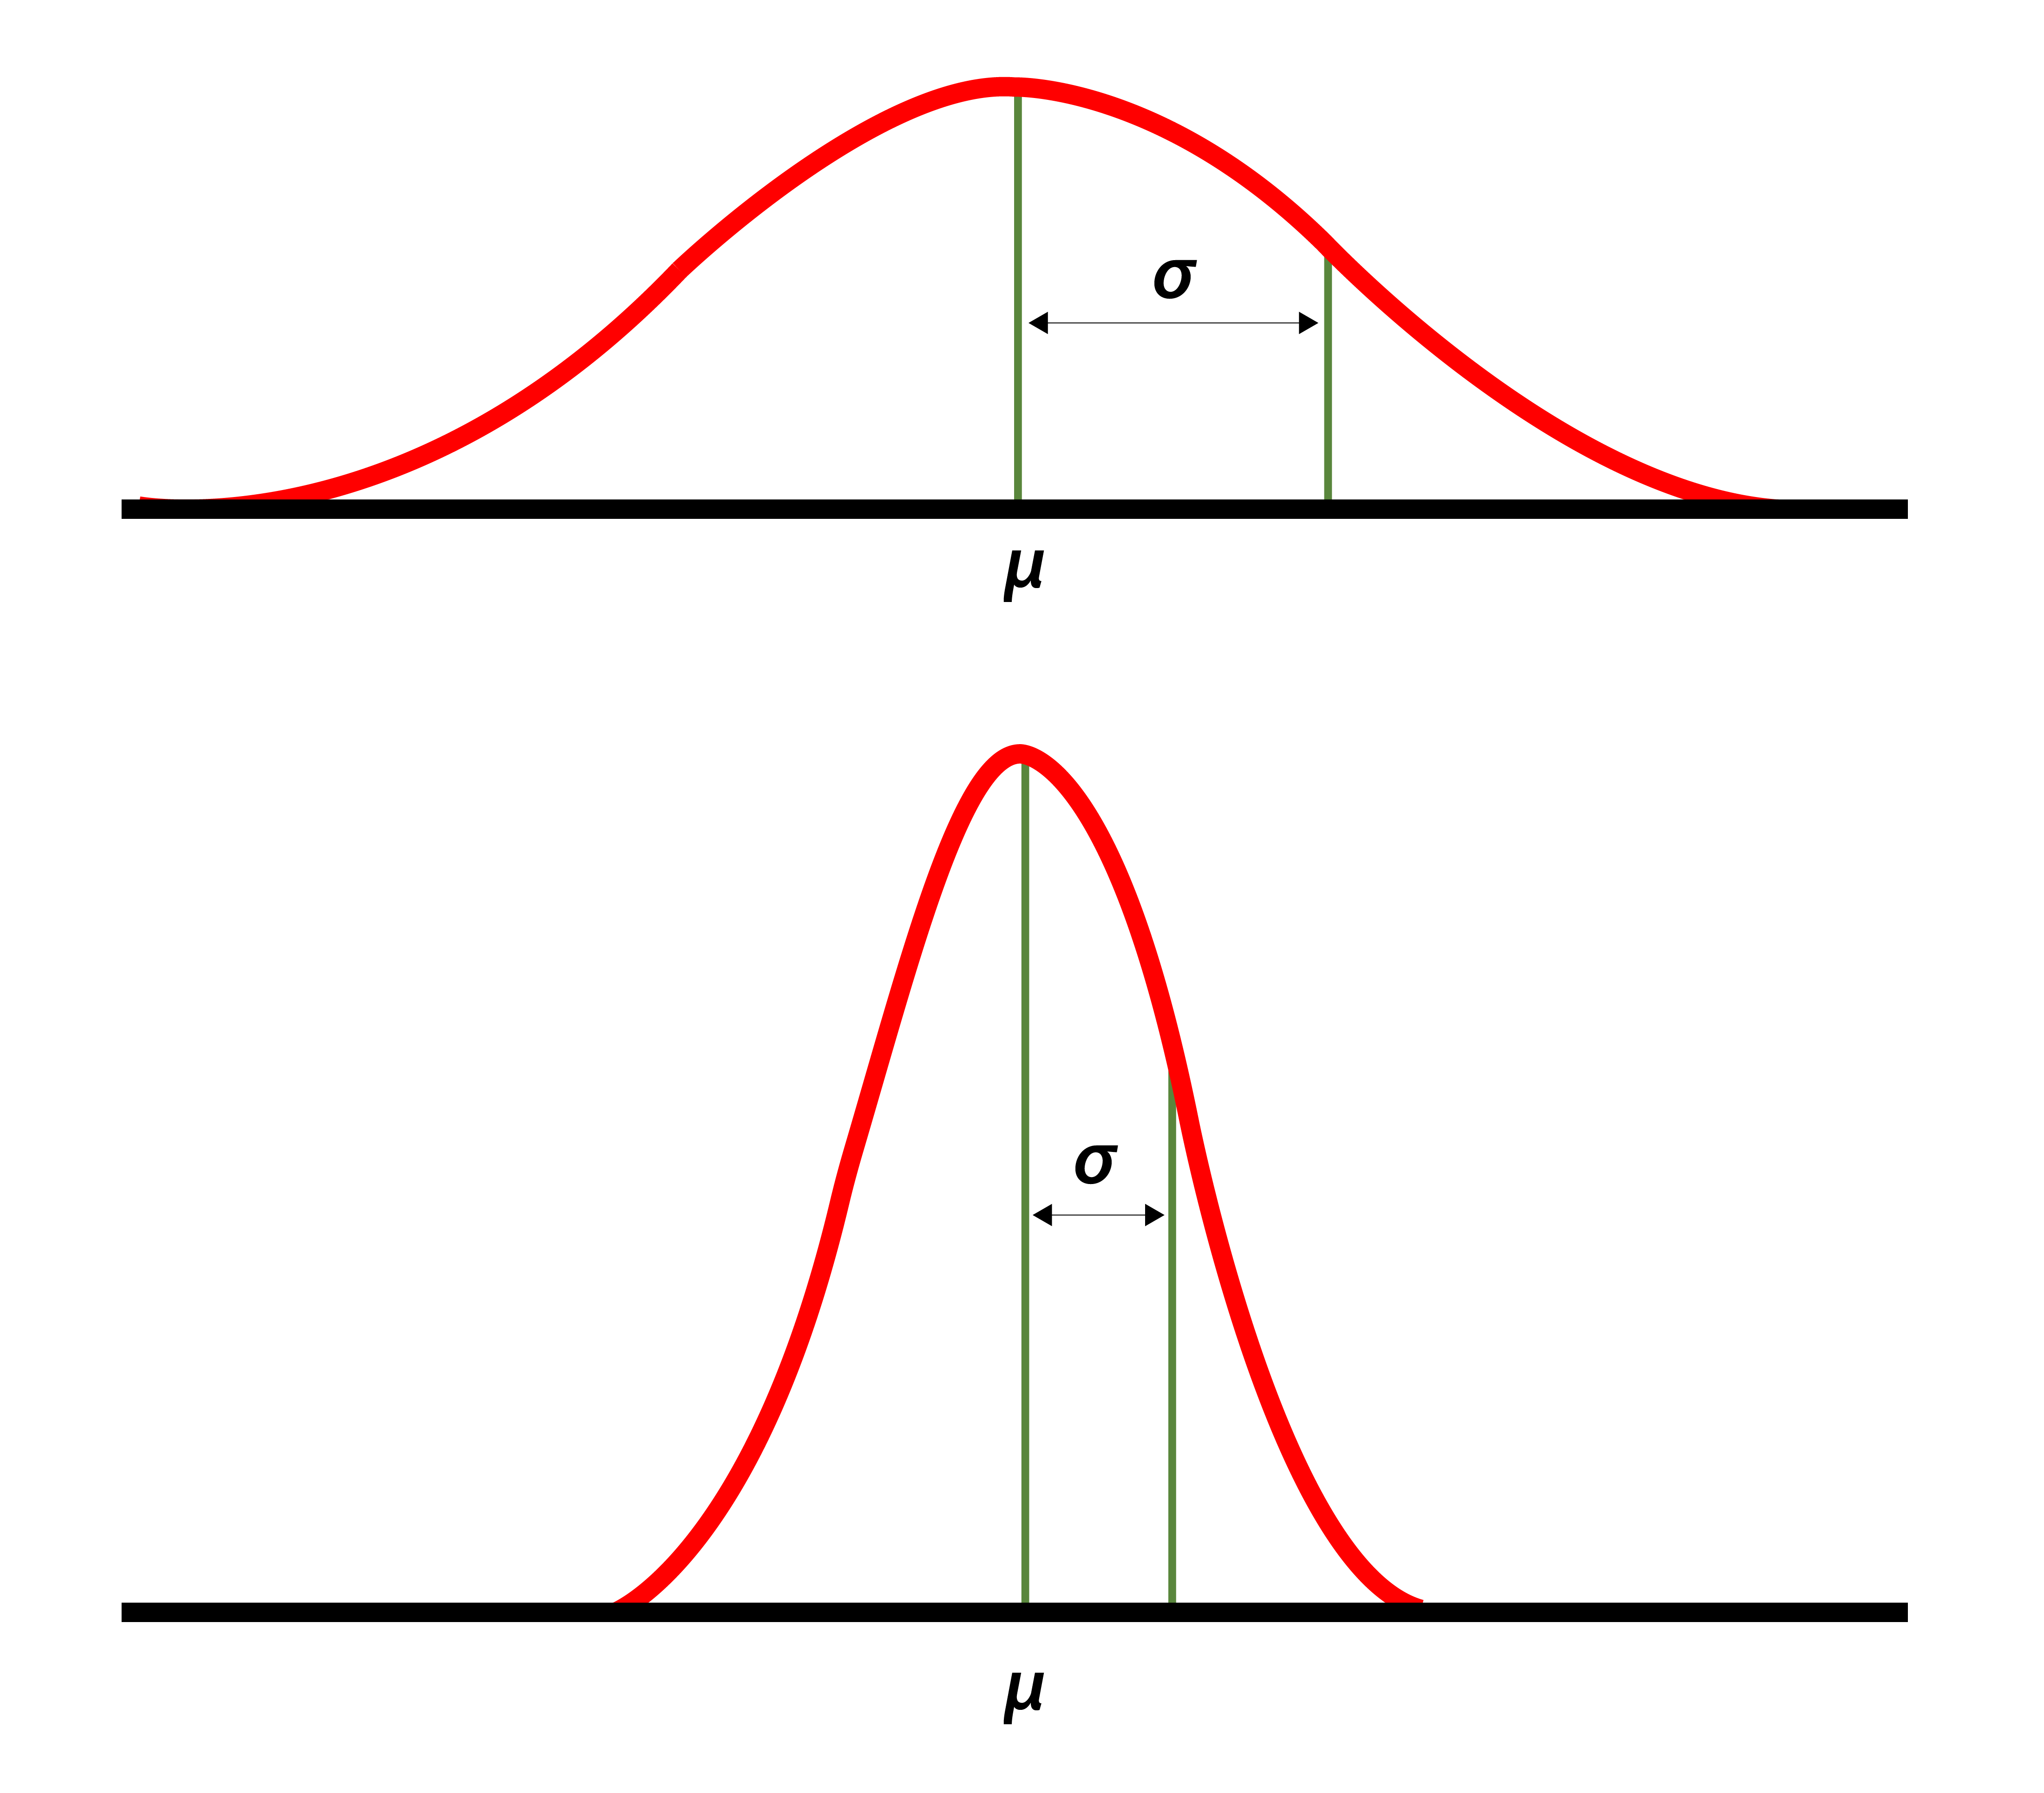
Standard deviation is a statistical measure that indicates the dispersion or variability of a set of values. The larger the standard deviation, the more spread out your data points are relative to the mean. In contrast, a smaller standard deviation indicates that the points tend to be closer to the mean. Understanding this concept is critical for effective data analysis and allows you to make data-driven decisions with Excel.
Why Use Excel for Standard Deviation Calculation?
Excel is equipped with a range of powerful statistical functions that enable users to perform complex analysis with ease. By using Excel, you can quickly compute standard deviation without the need for extensive manual calculations. This efficiency is especially beneficial when working with large datasets, where traditional methods would be time-consuming. Furthermore, Excel statistics functions such as STDEV.P and STDEV.S streamline the calculation process, making it accessible even for beginners exploring statistical analysis in Excel.
Types of Standard Deviation in Excel
In Excel, you may come across two main types of standard deviation calculations: sample standard deviation and population standard deviation. The **STDEV.S function** calculates standard deviation for a sample of a population, while the **STDEV.P function** is used for the entire population. Choosing the correct function is vital for obtaining accurate results, as it directly impacts the interpretation of your data analysis. For example, if you’re working on a dataset representing a broader population, using STDEV.P would provide a more reliable analysis.
Calculating Standard Deviation in Excel
To effectively calculate standard deviation in Excel, it’s crucial to understand a few key formulas and functions. Below, we’ll cover the most common methods for computing standard deviation, helping you become proficient in your calculations.
Using the STDEV.S Function
The **STDEV.S function** is one of the most widely used functions for calculating sample standard deviation in Excel. Its syntax is straightforward and looks like this: =STDEV.S(number1, [number2], …). Here, “number1” is the first data point, and you can include additional points as needed. To illustrate, if you have a list of data in cells A1 to A10, you can calculate the sample standard deviation as follows:
=STDEV.S(A1:A10)
After entering this formula, Excel will return the standard deviation for the given data set. This method simplifies the computation, particularly for large data sets, allowing for enhanced data analysis in Excel.
Calculating Population Standard Deviation with STDEV.P
When working with the entire population data, you should use the `STDEV.P` function. This function calculates the standard deviation based on the population dataset, ensuring accuracy in understanding the variability in the entire group. The syntax for STDEV.P is =STDEV.P(number1, [number2], …). Similar to the STDEV.S function, this allows for single or multiple data points. For example:
=STDEV.P(A1:A10)
Using this function helps you reflect your dataset accurately by considering every element in your population, making it a vital skill for your statistical analysis in Excel.
Exploring Variance and Standard Deviation Excel
Variance is another important measure of data dispersion, and it is directly related to standard deviation. Specifically, the variance is the square of the standard deviation. In Excel, you can calculate variance using the **VAR.S** function for samples or **VAR.P** for populations. By understanding both measures, you gain deeper insights into your data variability and can effectively apply this knowledge across different Excel data analysis techniques.
Advanced Techniques for Finding Standard Deviation in Excel
Once you master the basic functions, consider exploring more advanced techniques for finding standard deviation, which will enhance your analytical skills further.
Using Array Formulas for Grouped Data
For datasets that require finding standard deviation for grouped data, Excel allows the use of array formulas. For instance, if your data is organized into categories and you want to calculate the standard deviation for each group, you can use an array formula in conjunction with the STDEV function. This technique may require using the Ctrl + Shift + Enter keys to create an array. Understanding this method provides a flexible approach to analyzing complex datasets effectively.
Graphical Representations of Standard Deviation
Visualizing standard deviation within your data plots can enhance your understanding of variability. Excel enables users to create charts that illustrate data distributions effectively. For example, adding error bars to your charts can show standard deviation ranges, allowing for better visual comprehension. This approach is particularly useful in presentations and reports where you need to communicate data insights at a glance.
Utilizing PivotTables for Standard Deviation Analysis
PivotTables are another powerful tool in Excel for conducting data analysis. By summarizing large datasets into more manageable categories, you can compute standard deviations for those categories in a few simple clicks. This not only makes the analysis simpler but also can reveal important trends and insights across your dataset. By mastering PivotTables, you enhance your capability in excel data visualization and overall statistical analysis.
Key Takeaways
- Standard deviation is a key statistical measure for understanding data dispersion.
- Excel provides powerful functions like STDEV.S and STDEV.P for easy calculation.
- Understanding the differences between sample and population standard deviations is crucial.
- Using array formulas and PivotTables can enhance your analytical capabilities.
- Graphical representations of standard deviation improve data presentation.
FAQ
1. What is the difference between STDEV.S and STDEV.P functions in Excel?
The primary difference lies in the dataset being analyzed. STDEV.S is used for calculating the standard deviation of a sample from a population, while STDEV.P is used for the entire population dataset. Selecting the correct function is critical for accurate results in your statistical analysis.
2. How can I calculate the standard deviation for grouped data in Excel?
To calculate for grouped data, use an array formula in conjunction with the STDEV function. This allows you to define categories within your data while effectively computing standard deviation, revealing insightful analysis on data distributions.
3. Can I visualize standard deviation in my Excel charts?
Yes, Excel allows you to add error bars to your charts, which can effectively illustrate standard deviation ranges. This visual representation is useful for communicating data insights in reports or presentations.
4. Why is understanding the standard deviation vital for business analytics?
Understanding standard deviation is key for any data-related decision-making process. It helps businesses assess data variability, making it easier to identify potential risks, forecast trends, and drive effective strategies based on reliable data analysis.
5. Where can I find more resources for learning Excel?
There are numerous online resources, including Excel training platforms, tutorials, and communities focused on improving skills in Excel. Websites like YouTube, Microsoft’s official support page, and various data analysis blogs provide valuable information and advanced techniques.
6. How do I ensure accuracy in my Excel statistical analysis?
To achieve accuracy in your analysis, regularly check your data input for errors, use the correct statistical functions for your datasets, and familiarize yourself with Excel’s data analysis tools. Consistent practice in applying functions will enhance data skills and confidence.
7. What is the role of variance in understanding standard deviation?
Variance measures how far a set of numbers is spread out from the mean, and it’s crucial as it feeds into the calculation of standard deviation. A solid understanding of variance provides insight into the overall dispersion, making it easier to interpret standard deviation results.